Authority
The Smart Streets chapter authorizes camera-based parking enforcement on public transit vehicles, city vehicles, city property, and locations identified by CDOT inside the pilot area.
Municipal Code Chapter 9-108Chicago Department of Finance FOIA Analysis
Explore automated parking enforcement: warnings, tickets, listed fines, and street patterns. FOIA data obtained by Alex Cannon. Updated through September 12, 2026.
Background
The core policy question is whether automated enforcement can keep scarce street space clear enough for bus riders, bicyclists, and curb users without relying only on manual enforcement.
The Smart Streets chapter authorizes camera-based parking enforcement on public transit vehicles, city vehicles, city property, and locations identified by CDOT inside the pilot area.
Municipal Code Chapter 9-108The ordinance provides a 30-day installation warning period and a first-offense warning before a citation for covered offenses enforced through the program.
2023 ordinance PDFCTA added six bus-mounted Automated Bus Lane Enforcement systems in October 2025, after city vehicles had already started Smart Streets operations.
CTA launch releaseGeography
Explore locations in the selected ward. Choose a violation type to drill into the map; larger points represent more violations.
All Violations, aggregated by location.
Trends
See how the balance of warnings and fine-bearing tickets changes over the reporting period.
Stacked violations by violation description. September 2026 is partial, through September 12.
Hover or focus a month for its snapshot. Click or press Enter to keep it selected; use arrow keys to explore.
Fines
Fine levels listed in the FOIA export, grouped by issue date and calendar year.
Camera IDs beginning with FI are grouped as Finance, DT as Transportation, and unprefixed IDs as CTA Bus.
Timing
Categories
Compare the dollar contribution of each violation type within the selected ward.
Fine-bearing categories only, through the final date in the extract.
Hotspots
Monthly sparklines start at each metric's first observation and use their own scale. Hover or focus a line to inspect months; the final month is partial.
Choose one or more infraction categories for the corridor and location rankings.
Aggregated from the violation location string.
Individual address points ranked by the selected sort and category filter.
| Location | Violations | Fines |
|---|
Comparison
| Period | Bike lane | Bus lane | Bus/taxi/carriage stand | Total |
|---|
| Violation | Conventional tickets | Smart Streets fine-bearing tickets |
|---|
Details
Ward totals use the same decoded violation points as the map, assigned to Chicago ward polygons from the City of Chicago Data Portal.
Monthly sparklines start at each metric's first observation and use their own scale. Hover or focus a line to inspect months; the final month is partial.
Showing all violation types.
| Ward ▲ | Violations ▲ | Fine-bearing ▲ | Warnings ▲ | Listed fines ▲ | Top violation type | Top fine category |
|---|
Design
Enforcement is a backstop. If the same block keeps producing warnings and tickets, the street is showing where design is failing and where physical changes could make the illegal move harder or less useful in the first place.
Compare the protected stretch from Milwaukee to Wells with the paint-only area east of Wells. The counts below and the map follow the selected ward; the street photographs illustrate the treatments.
Bike-lane and warning points along Kinzie, with the Milwaukee-to-Wells protected stretch contrasted against the paint-only area that produced the corridor's highest bike-lane ticket concentration.
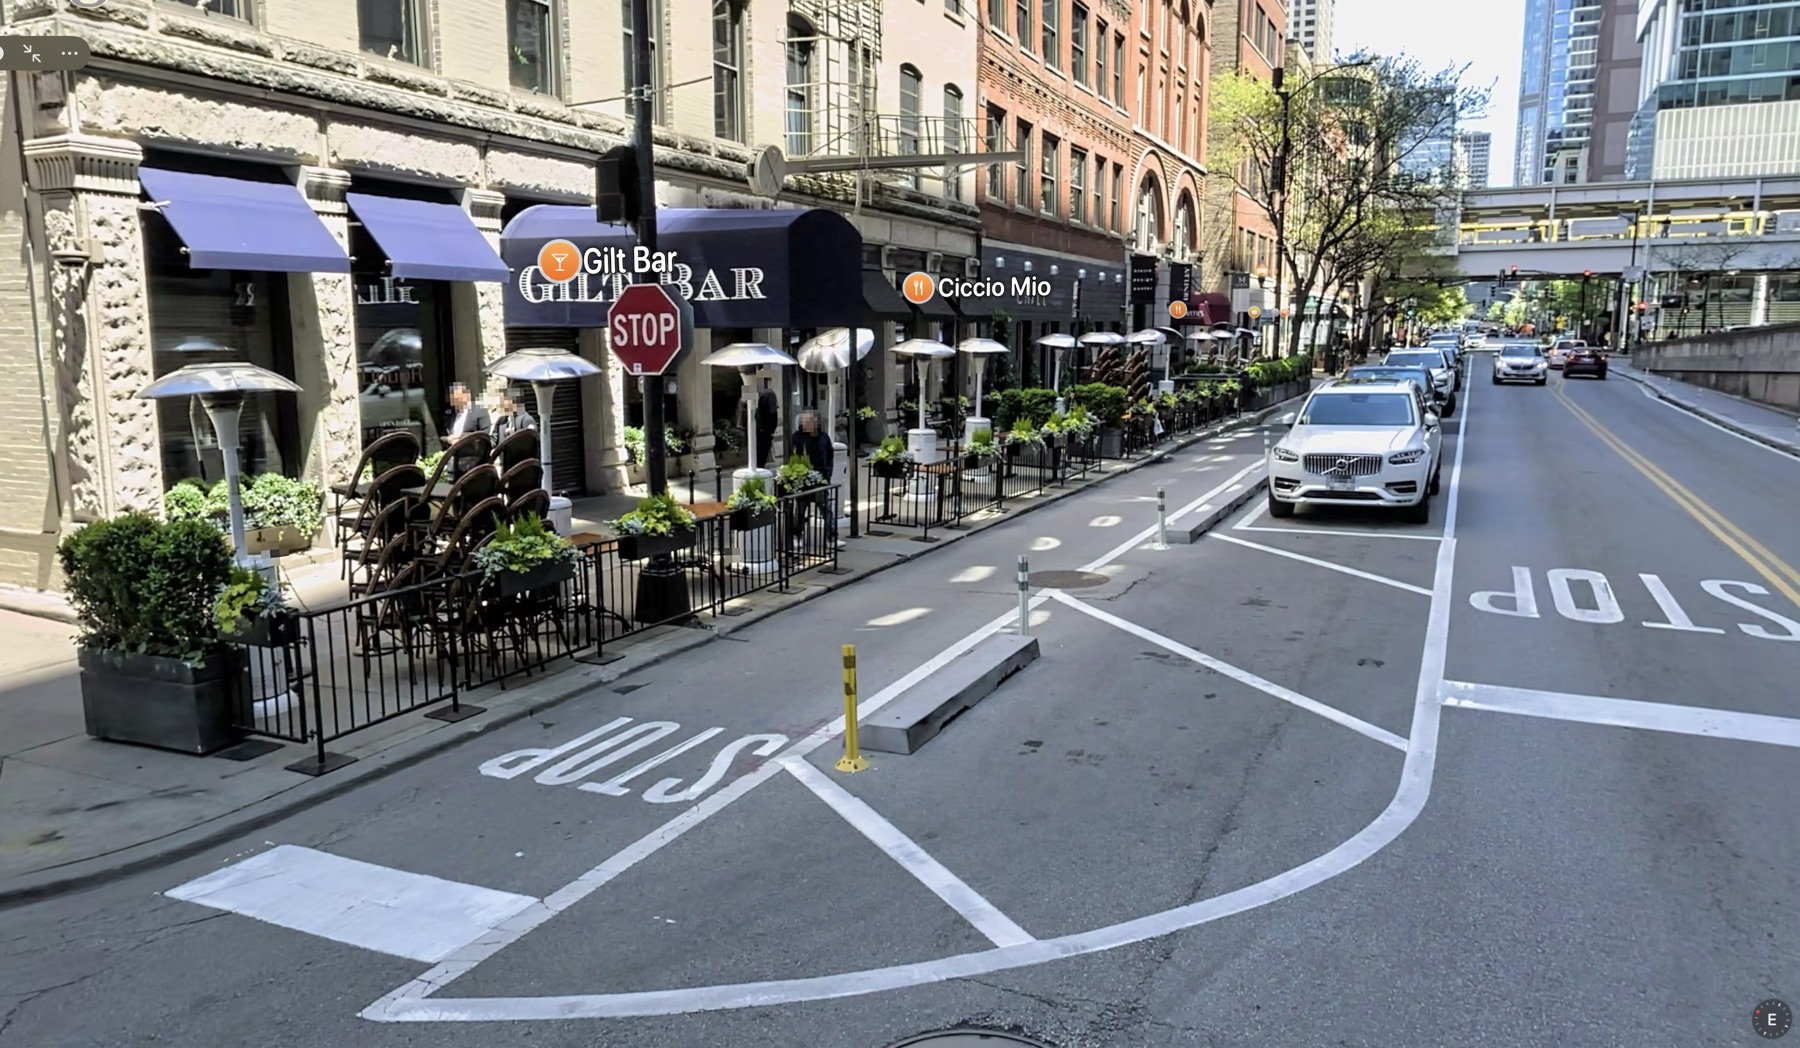
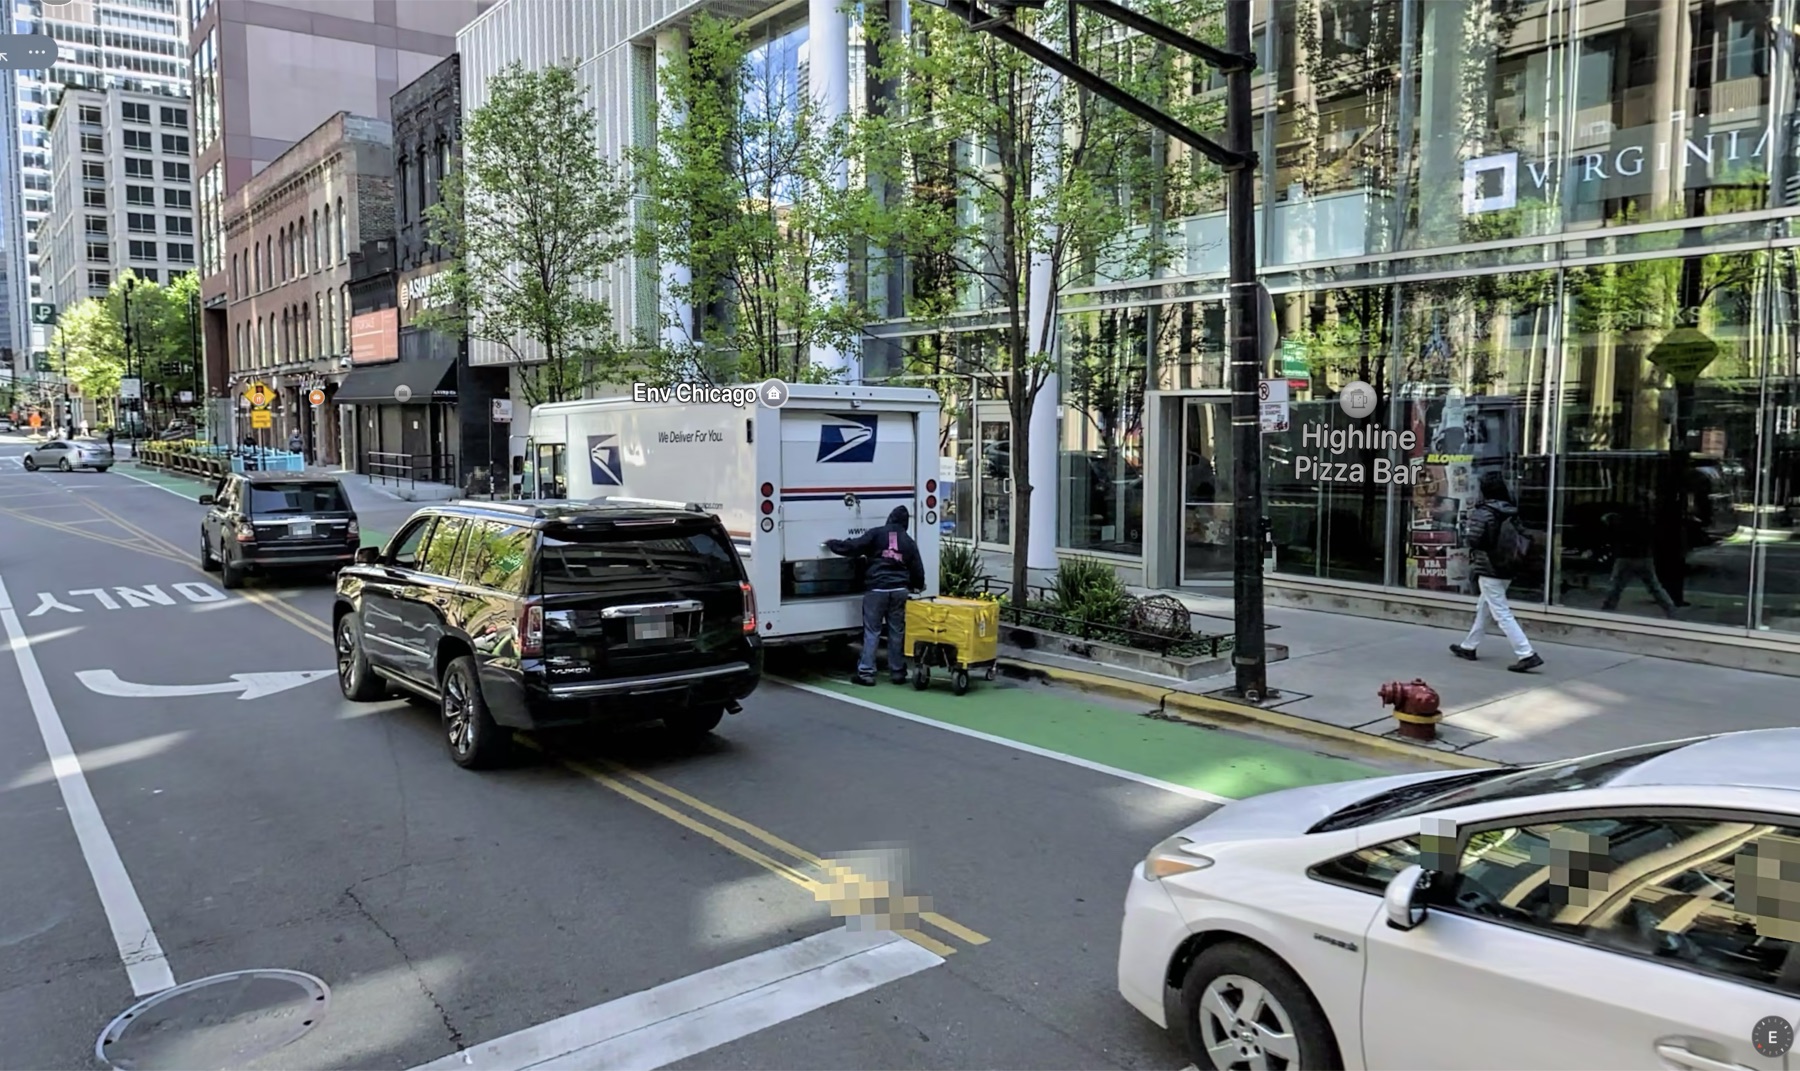
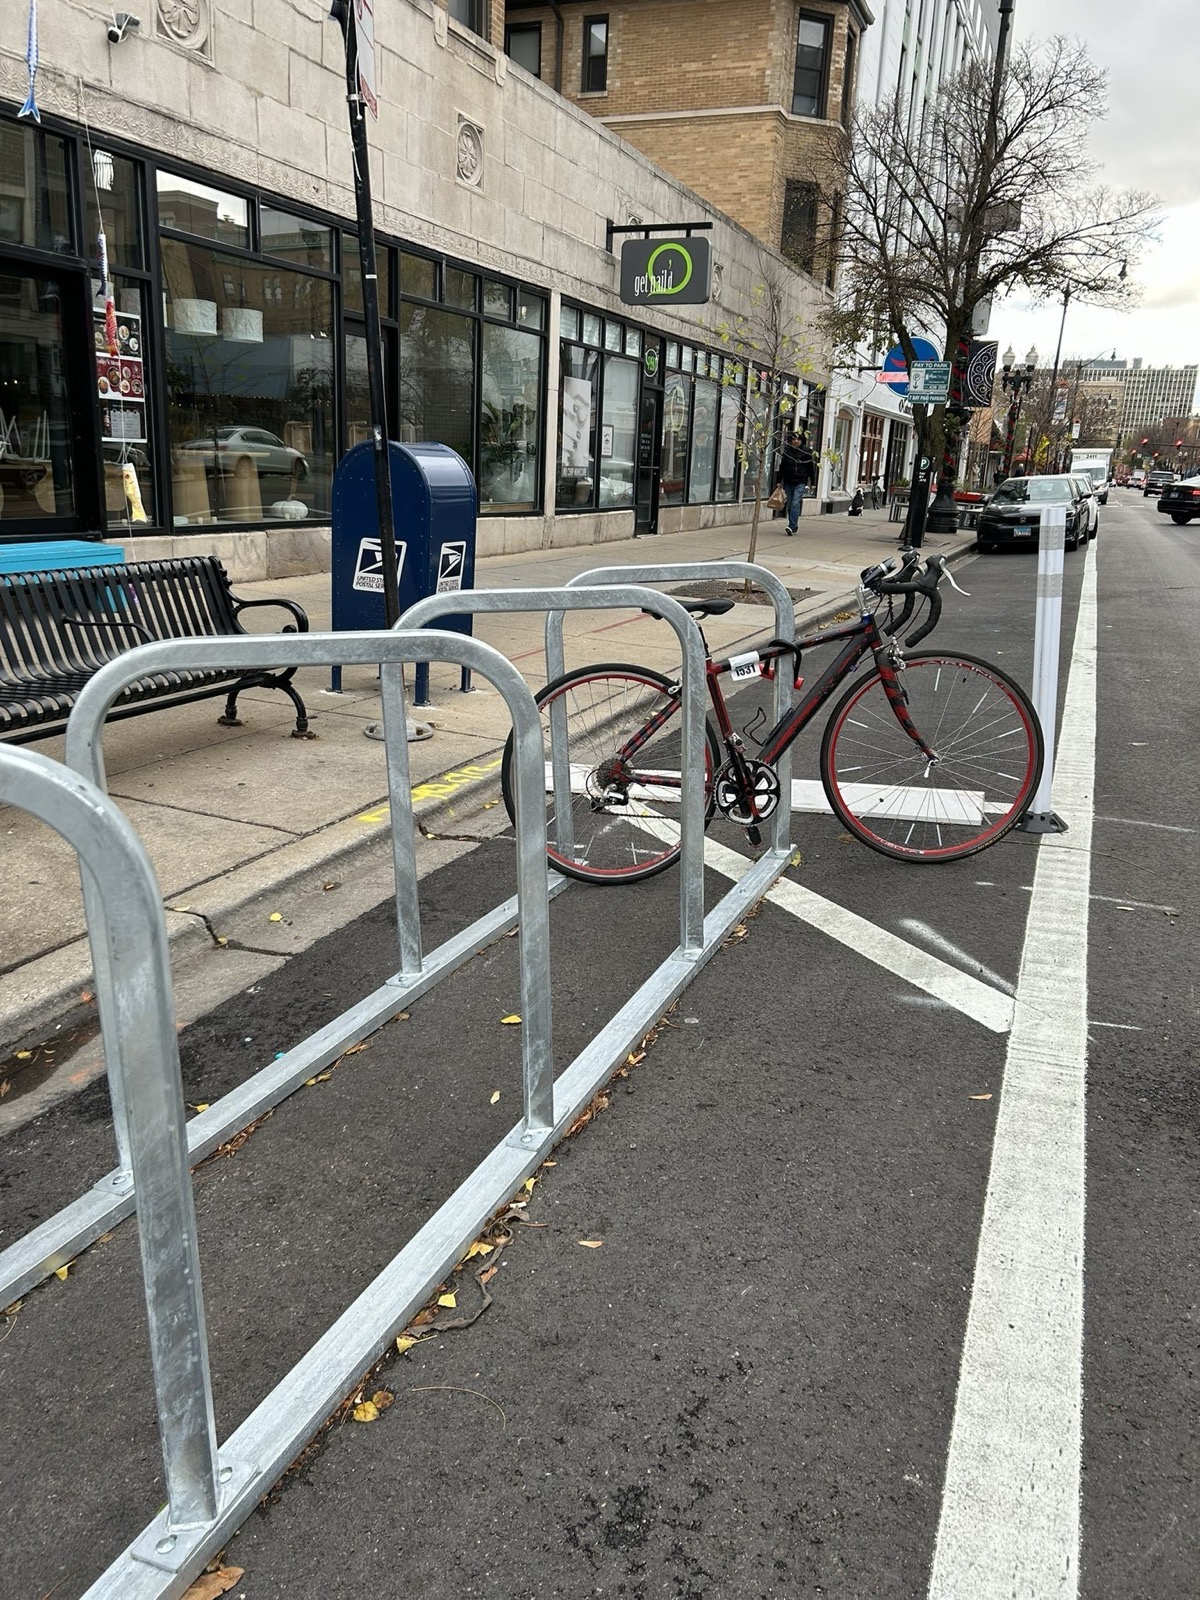
Bike-lane citations dominate the Kinzie fine signal. Paint-only segments should be upgraded to curb-protected bikeways, with corner space reclaimed so stopping, loading, and parking do not spill into the bike lane.
Start with blocks where curb friction keeps landing in the bikeway.
FHWA separated bike-lane guide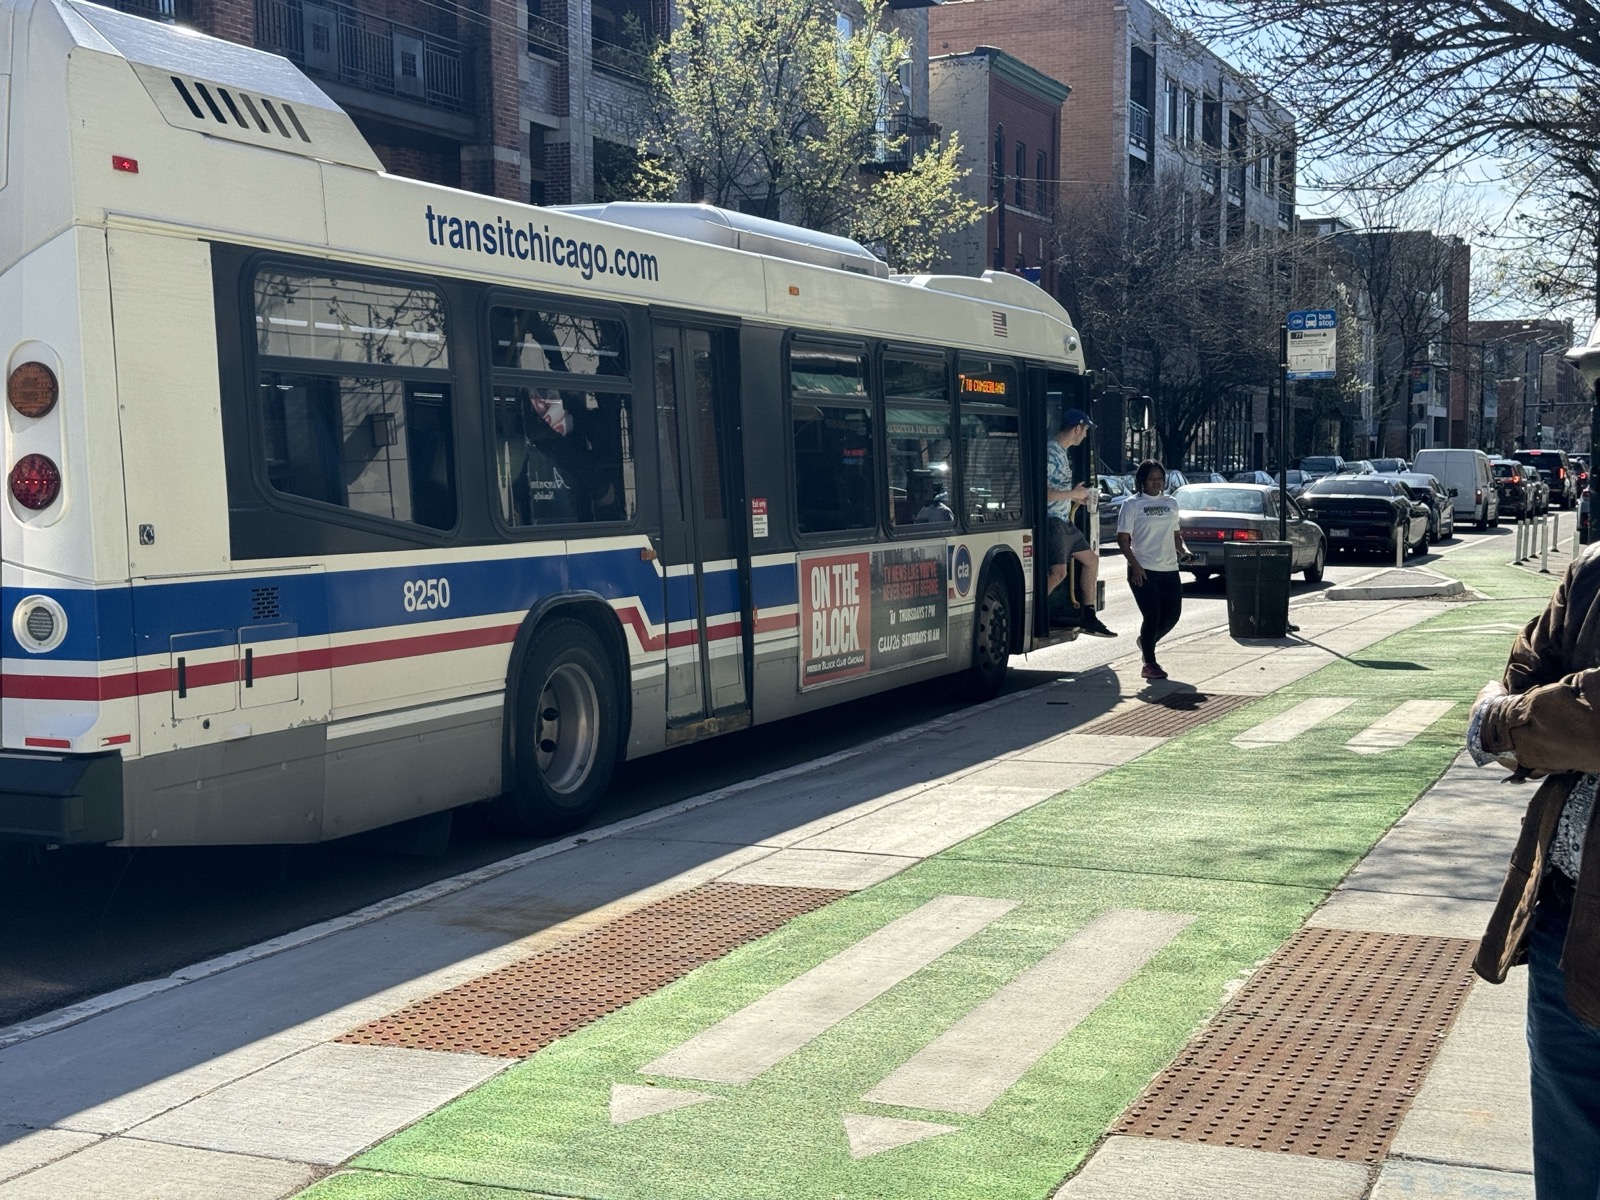
CTA and CDOT say bus stop bump-outs and boarding islands create dedicated rider space, let buses stop without weaving, and reduce bus-bike conflicts. They also make it much harder for drivers to idle in the stop itself.
Best fit for high-ridership stops where buses keep getting boxed out of the curb.
CTA/CDOT bus-stop upgrades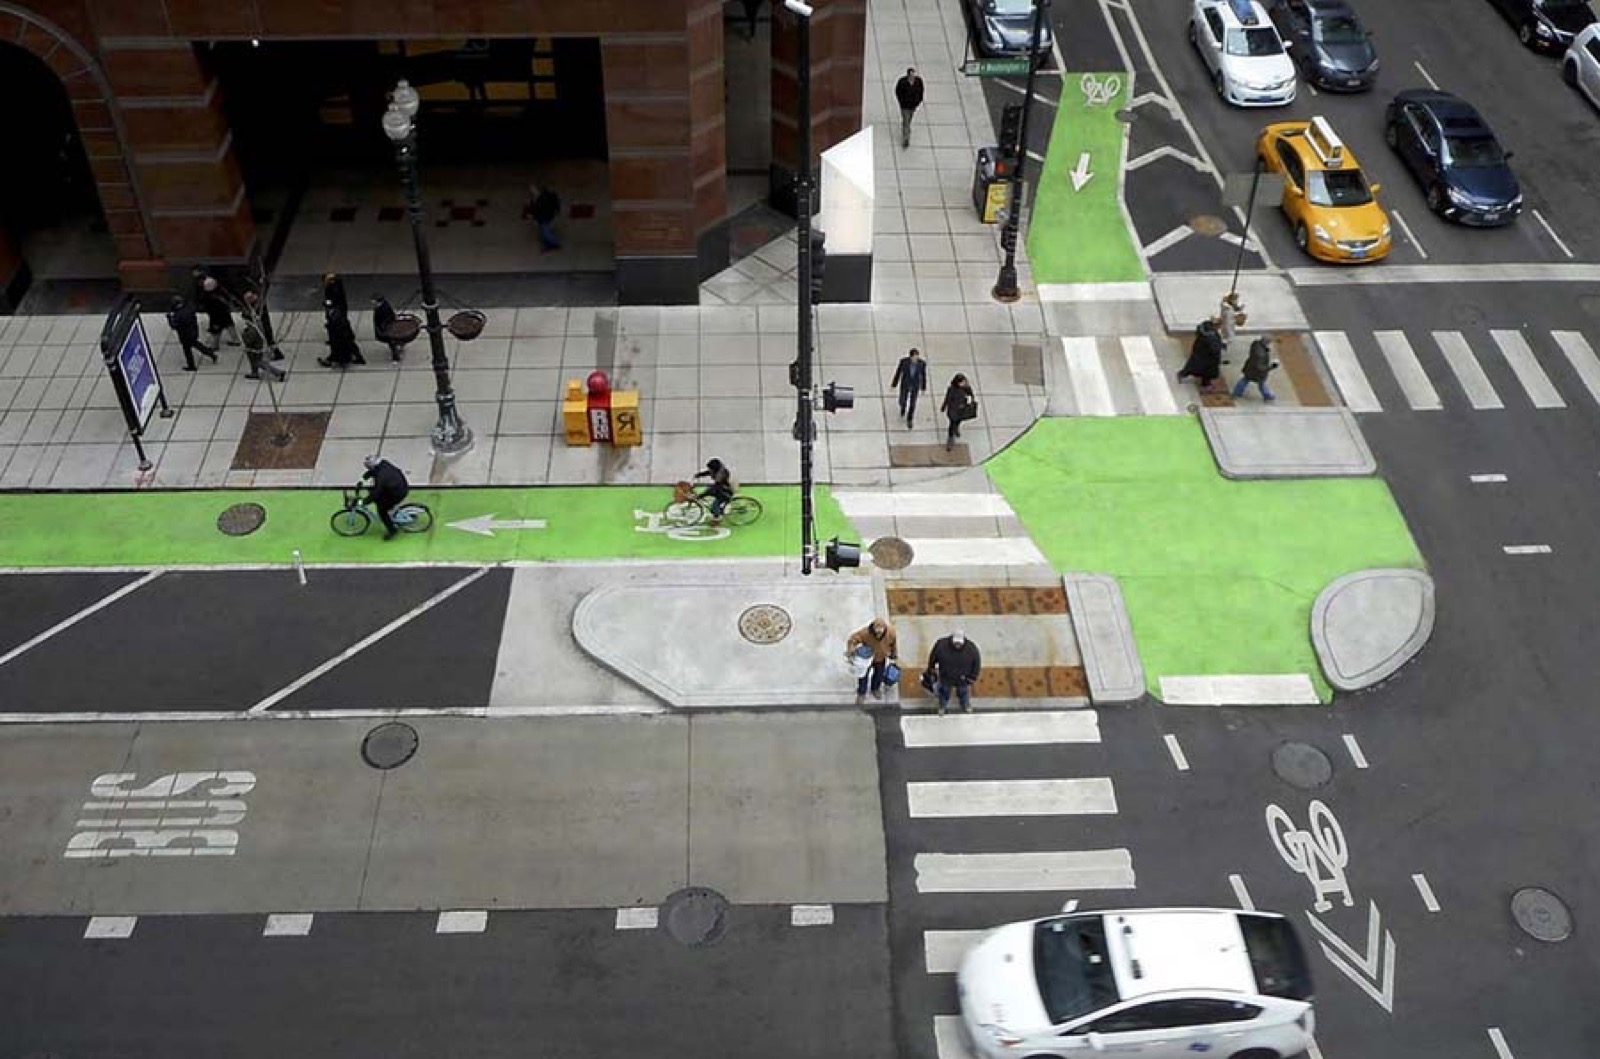
Shorter crossings, hardened corners, and raised tables slow turns, protect pedestrian waiting space, and keep sightlines open. FHWA treats refuge islands and raised crossings as proven pedestrian safety countermeasures.
Prioritize bus-stop pairs, school crossings, and retail corners where blocked crosswalks and quick curb stops are common.
FHWA pedestrian countermeasures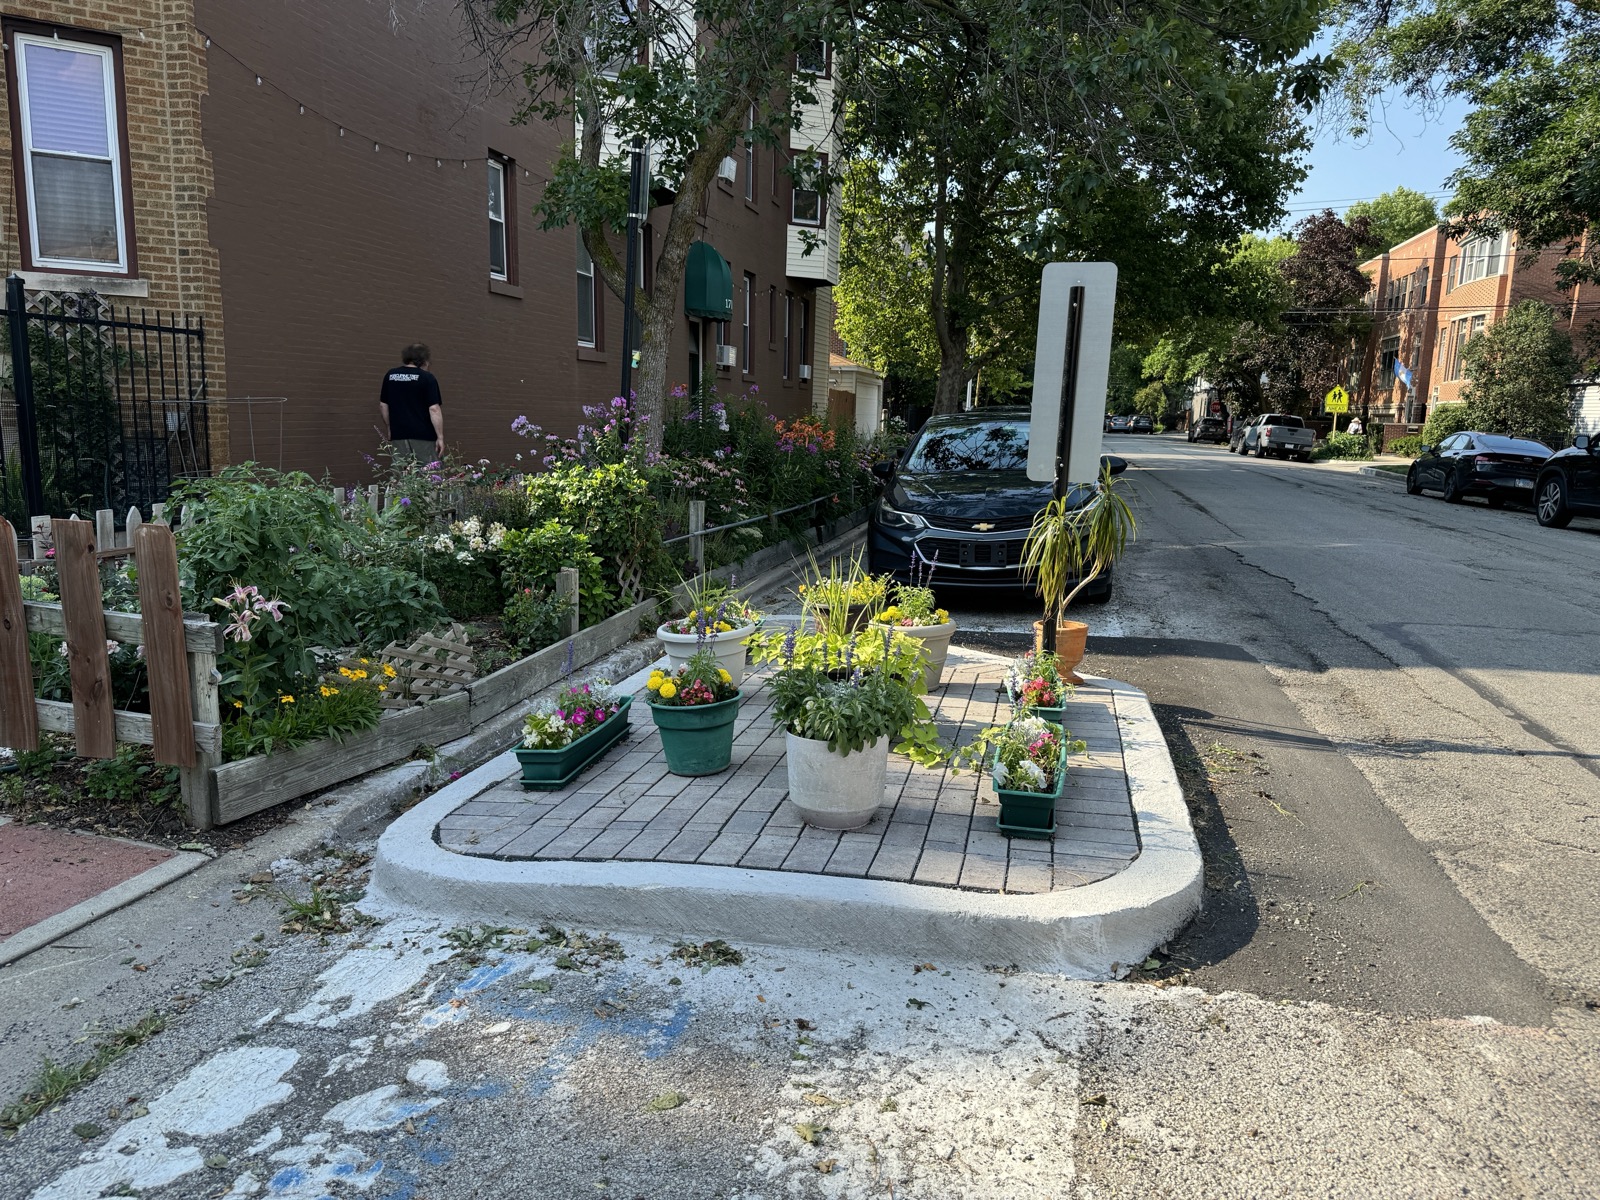
Some conflicts come from curb demand with nowhere legal to go. Curb extensions and dayparted loading zones can define where deliveries, pickup, and short-term standing belong while tightening the curb edge near corners and crossings.
Pair managed loading space with bump-outs where corner encroachment is common.
Smart Loading Zone authorityThe point is not that cameras solve a street-design problem. The camera data is a diagnostic layer: when violations concentrate on the same corridor, the next response should be protected bike lanes, bus boarding islands, hardened daylighting, refuge islands, and curb-management changes that remove the recurring conflict.
Reference
Monthly sparklines start at each metric's first observation and use their own scale. Hover or focus a line to inspect months; the final month is partial.
| Infraction category | Violations | Fine-bearing violations | Warnings | Listed fines | Fine share |
|---|